
Betting on sport is, by nature, a very uncertain business, but can bettors keep a tight grip on the randomness of it all? Joseph Buchdahl looks at the best way to tackle the inevitable randomness in sports betting.

In December 2012, Mirio Mella published an article for Pinnacle Sports discussing the illusion of control and the misinterpretation of meaningless correlations in data that are inherently random, uncontrollable and unpredictable.
In sports betting, the idea that outcomes can yield to the application of information and knowledge about a team or player can give rise to an exaggerated sense of belief in one’s predictive ability. As Mella says, “a little information is a dangerous thing.”
Furthermore, our self-serving attribution bias ensures that we are more likely to associate forecasting successes to internal attributes (I am a skilled forecaster and my skill led to a correct call), whilst associating failures with external attributes (I was unlucky).
Despite being unpalatable to our craving for control, the reality is that, like weather forecasting and the stock market, sports betting is inherently a very uncertain business, where the evolution of a game is complex, chaotic, and conceivably even non-deterministic if we concede that what takes place might be largely influenced by the quantum world.
Of course, most punters appreciate that, on a bet-by-bet basis, luck (either good or bad) has a lot to do with whether we win or lose. But how much does chance influence things over longer periods?
To ensure that we are not fooled by randomness, a useful exercise is to analyse just how much inherent random variability actually exists in sporting outcomes.
One way we can do this is plot a time series of hypothetical betting returns from fair odds to see how much they vary over different time scales. Betting odds merely represent probability estimates for our expectations.
The wisdom of (betting) crowds ensures that, on average, these odds prove to be a very reliable indicator of ‘true’ probabilities. But randomness ensures that outcomes frequently deviate from idealised market expectations. Let’s take a look at how.
The first time series below plots the 10-match moving average level-stakes return on investment (or yield) for betting on all home, draw and away outcomes for ten seasons of English league football matches (2005/06 to 2014/15).
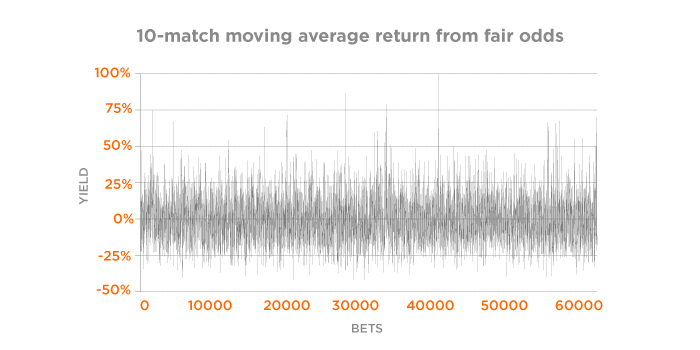
The fair betting odds are based on real market average match betting odds with the bookmaker’s profit margin removed.
The time series is full of noise. Unsurprisingly, the majority of punters will recognise and accept that over small samples of just 30 bets, unexpected results will cause significant deviation from the expectation of 0%.
Lucky underdog winners, for example, will push the line well above zero, whilst an excess of winning favourites that offer proportionally smaller (level stakes) returns will drop it below zero.
Yet some of you might nonetheless be surprised to see the magnitude of the fluctuations over a range as large a 50%. Had you been showing a yield of 50% after 30 wagers, would you be attributing that to your skill, or would you simply write it off as good fortune?
On the other hand, if you were down -30%, would you have the confidence to recognise that your performance had been unlucky and could be expected to start regressing towards the mean?
The second time series shows the 100-match moving average level-stakes returns. There remains considerable inherent random variability over a 20% range about break-even. The largest deviation was a whopping 23.5% from 300 bets.
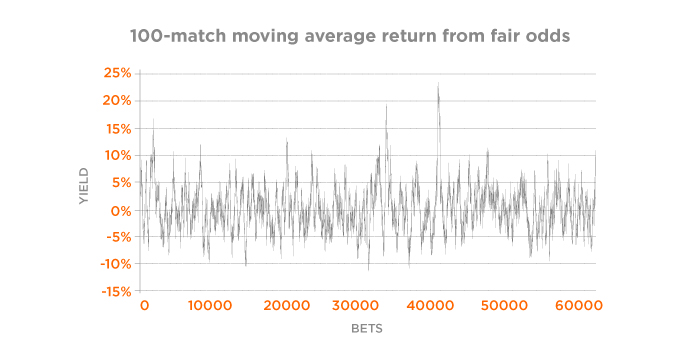
How would you be feeling after such a performance? Lucky, or would you be telling everyone you’d found the Holy Grail of sports prediction?
Finally, we have the plot for the 1000-match moving average level-stakes returns. There is still a considerable residual inherent random variability. Remember, 1,000 matches imply 3,000 bets.
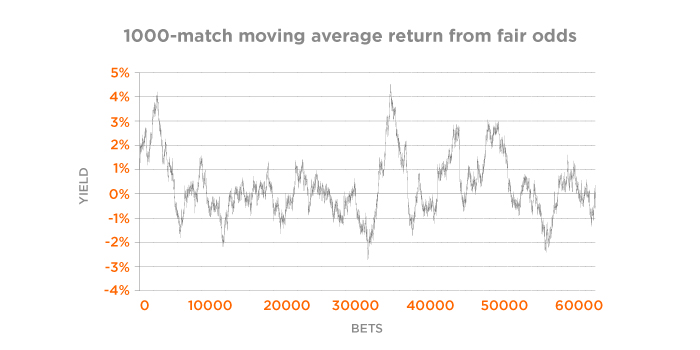
That’s typically more than the vast majority of punters will wager over the course of several seasons, and yet even over samples as large as this, we can experience sizeable deviations of several per cent for some considerable period of time.
You might at this point be arguing that all this analysis is really rather academic. No-one is blanket betting all homes, draws and aways in football matches. That is obviously true. Nevertheless, take any sample of your own betting series and you will be able to find the same noisy random variability in the evolution of your returns that exists in any complex system where outcomes are shrouded in significant uncertainty.
The key message is this: just because you might have shown a 20% yield after 300 wagers or a 4% yield after 3,000 wagers does not imply that your skill caused that to happen. Unless you are aware of the level of randomness in sports across all time scales, you are likely be fooled by your own self-serving attributions biases.
The sharpest punters recognise that whilst they are better at forecasting sporting outcomes than the remainder of their competition, most of what happens in sports is largely a matter of chance.
As Nate Silver, who demonstrated that a skilled poker player could still be showing losses after 100,000 unlucky hands, might say, the signal is weak and the noise is loud.
![]()
MORE: TOP 100 Online Bookmakers >>>
MORE: TOP 20 Cryptocurrency Sportsbooks >>>
MORE: Best E-Sports Betting Sites >>>
Source: pinnacle.com