
Sports bettors who fail to recognise randomness in betting are fighting a losing battle. How can we spot randomness in betting and how can you test how much of your success or failure is down to randomness? Read on to find out.

One of my earliest articles published by Pinnacle nearly three years ago investigated the topic of randomness in betting. In this article I’d like to revisit it.
Betting is, of course, a results business but underlying your profits and losses is the world of probability. A bookmaker’s odds reflect those probabilities – the chances of things happening. Bettors try to find more accurate probabilities with the possibility of gaining expected value.
However, as Pinnacle’s Trading Director Marco Blume reminded us in a recent betting podcast hosted by Pinnacle, you only know if you won or lost. You never actually know for sure if you were accurate or inaccurate in your assessment of those probabilities, at least not for individual bets.
Sources of uncertainty
There are arguably two sources of uncertainty in betting. Firstly, your forecast model of the true percentage of an outcome might be valid, but that outcome is binary. If you’re lucky it wins, if you’re unlucky it loses.
The French mathematician Pierre-Simon Laplace believed that luck or chance merely reflected incomplete knowledge about something. As such, randomness would merely be an illusion. He argued that if you could know “all [the] forces that set nature in motion, and all [the] positions of all [the] items of which nature is composed” then “nothing would be uncertain” and those betting probabilities would reduce to 0s and 1s. Intuitively it’s a postulate that seems to makes sense.
If you’re winning/losing more than you think you should, you might have been lucky/unlucky, or perhaps your model is invalid; or both.
Indeed, this way of thinking forms the basis of the Brier Score method which attempts to evaluate the accuracy of predictions. In practical terms, however, the complex nature of systems such as a sporting contest would make the data analysis required to fulfil Laplace’s dream impossible. Chaos theory tells us that slight variations in the starting points lead to wildly different outcomes. We would never have enough information to know for certain.
But more than this, the physics of the very small (the atomic and subatomic world) makes this not just a practical impossibility, but a fundamental one as well. Heisenberg’s Uncertainty Principle tells us that you cannot know precisely both the position and momentum of something perfectly. Not because you don’t have enough information, but because this is the fundamental nature of reality.
If you can’t know the state of something perfectly now, how can you begin to predict what might happen to it in the future? One might argue that the subatomic world doesn’t have very much to do with things that happen in betting. However, since, the world we see around us emerges out of it we should at least consider it to be significant. Certainly there are some scientists who have already done so.
Given these practical and theoretical limitations, then, it is perfectly acceptable to consider the randomness of good and bad luck as inherent to the system being analysed, and hence the concept of a ‘true’ non-binary probability as being a useful one.
The second source of uncertainty is the validity of your forecast model itself. How do you know whether your assessment of the probability of an outcome was accurate? As Marco hinted, winning and losing individual bets cannot help us answer that question.
Winning a bet with odds of 2.00 might feel nice, but it won’t tell us whether our belief that it had a 55% chance of happening was correct. What if you had a thousand of these bets, and you won 45% of them? You might very well conclude that, on average, your forecast probabilities were invalid. What if you won 65% of them? You’re winning big, but isn’t the model just as invalid?
To a significant extent these two sources of uncertainty are indistinguishable. If you’re winning/losing more than you think you should, you might have been lucky/unlucky, or perhaps your model is invalid; or both. In the remainder of this article, I want to look again at what all this means for how we might think about our own betting history.
A real betting model
Those readers who follow me on Twitter are probably aware of my Wisdom of the Crowds betting system. It’s not a sophisticated system that makes clever forecasting predictions. It simply assumes that Pinnacle knows best when it comes to the accuracy of betting odds. If we then strip out their margin we get what could be considered ‘true’ odds, reflecting the ‘true’ probabilities of soccer match outcomes.
The idea that a betting model, even a valid one, can be expected to match expectation all the time, or even some of the time, should have been well and truly put to bed.
In my last pair of articles I recognised that Pinnacle won’t be right all the time, which is to say that their odds are not perfectly efficient. On average, however, over samples of odds there is strong evidence to say that they are. If we know what the ‘true’ odds are, then it’s simply a matter of finding odds somewhere else that are longer. If the model is correct over the long term then we should make a profit equivalent to the advantage we hold. Let’s look at the data.
Since August 2015 when I first began publishing suggested value picks, there have been 7,432 of them, with average odds of 3.91 (minimum 1.11, maximum 67.00, median 2.99) and an average expected value of 4.17% (implying a predicted 104.17% return on investment).
The profit history below shows how actual performance has compared to expectation based on a level staking strategy of 1 unit per bet.
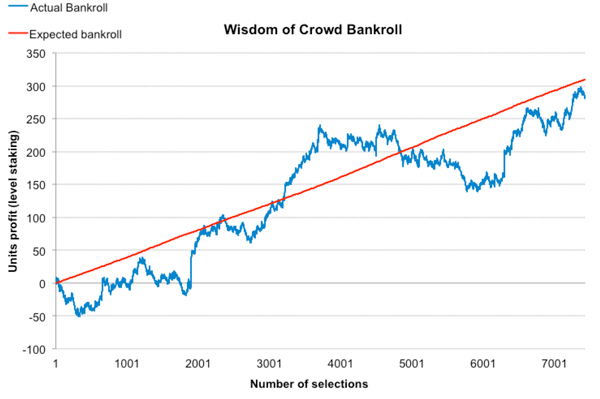
The actual evolution of profits provides confirmation, if it were needed, that the law of small numbers can mislead terribly, even when ‘small’ is actually quite large. At numerous points we could have made a case for throwing in the towel. Indeed, the largest drawdown in the middle lasted for over 2,000 bets. Nevertheless, despite the repeated ups and downs over numerous time scales the performance as a whole is actually pretty close to expectation. The actual return on investment is 103.80%
On average, then, this might imply validity in the model. Over the shorter term, however, we cannot be sure that our model is always doing what it should. However, as we explained before we cannot separate the randomness of good and bad luck in outcomes from the randomness in over and underperformance of our prediction model. But let’s take a closer look at how our actual performance deviates from expectation.
Measuring deviations from expectation
The simplest way to measure deviation from expectation (that is to say the blue line from the red line at any point in the betting history) is to calculate the difference between expected profit and actual profit.
For individual bets, however, this is not particularly informative, as we know they win (profit = odds – 1) or lose (profit = –1). There would simply be too much variation to make any sense of anything. Over larger samples, however, patterns begin to emerge. Here is the history of deviations from expectation for a 100-bet running average time series.
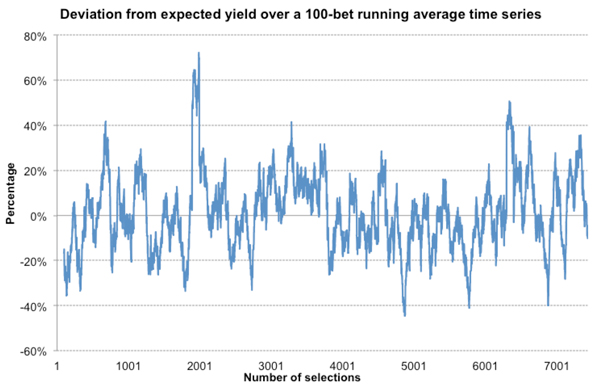
It’s a pretty wild picture to say the least, with lots of over and under performance over a 100-bet time period in excess of ±20%, and on one occasion by over 70%.
To reiterate, we don’t know how much of this variance is because our model deviates from what it should be doing over this time scale, and how much is just down to good and bad luck. What we can say, however, is that there is a lot of it, and presumably all just happening because of chance.
How do things look over a longer ‘time’ scale? Here’s the same chart for 1,000-bet running averages.
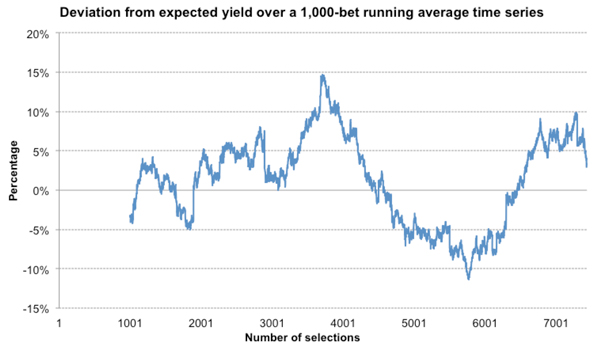
Unsurprisingly, there’s less variance and the deviations are smaller in magnitude, but it’s still considerable, with periods of over and under performance lasting thousands of bets. Maximum over-performance over 1,000 bets is 15%, whilst the equivalent for underperformance is -11%.
What are the chances of these deviations occurring? If we toss a coin 100 times we expect there to be 50 heads and 50 tails since that is the most likely outcome. It’s easy enough to calculate the chances of having 40 heads and 60 tails or vice versa. We can do the same for our betting history.
To calculate the probability of any deviation from expectation I have used my t-test approximation but it could just as readily be done using a Monte Carlo simulation. I performed both and the results were equivalent. First, the time series for the 100-bet running averages. Probabilities are depicted as a 1-in-x chance and the scale is logarithmic.
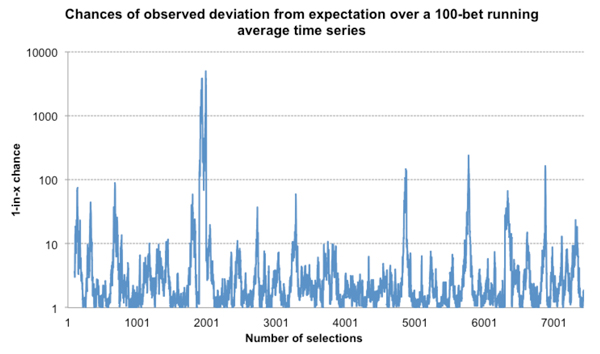
Again, we see a lot of variation, and on occasions some pretty unlikely deviations. There were several times where a 100-bet sample deviated from expectation by an amount that would only be expected to happen once in 100 occasions. Indeed, one sample had a 1-in-5,000 deviation – yet it is probable that almost all of it is happening just because of randomness.
Here’s the equivalent chart for the 1,000-bet running averages.

The idea that a betting model, even a valid one, can be expected to match expectation all the time, or even some of the time, should have been well and truly put to bed. Most of the time it isn’t, and to quite some considerable degree.
Of course, sharp bettors know that betting is a long game where the long-term average is all that matters. They will ride out periods of randomness, whether because of good and bad luck or an imperfect model over shorter time scales. Hopefully, I’ve made it clear again, as in my first article on randomness, that these timescales can be measured not just in 10s or 100s of bets, but in 1,000s too.
![]()
MORE: TOP 100 Online Bookmakers >>>
MORE: TOP 20 Cryptocurrency Sportsbooks >>>
MORE: Best E-Sports Betting Sites >>>
Source: pinnacle.com